In the last post we used GPUs to add two vectors, element by element. It’s what we call an embarrassingly parallel problem, but you might be thinking: is this all that GPUs are suited for? Doing independent things in parallel with no coordination?
One operation often arising in LLM inference is summing all elements of a vector. On a CPU, you would do this:
float sum(std::vector<float> &values) {
float acc = 0.0;
for (size_t idx = 0; idx < values.size(); ++idx) {
acc += values[idx];
}
return acc;
}How would you parallelize this? Each value is added to a common accumulator. If you’ve been around the block for a while, you’ll recognize this as a fertile ground for a classic race condition, also known as a lost update problem.
If we were to naively spawn a bunch of workers and process elements independently, at some point two workers would both read the current value of acc at the exact same time, add their respective values onto it, and the last one to write would win the race—the other would lose its update.
To solve this in CPU-land, you’d need some sort of coordination primitive like a lock: while one worker performs its read-then-update, others need to wait their turn. This contention kills performance.
But there is another way: each worker can take ownership of a section of the work to do, complete it in private, and then we can aggregate the partial results later. This is called privatization.
This is possible because addition is associative (1 + 2) + 3 = 1 + (2 + 3)
After each worker reduces its workload to a single partial sum, adding those partial sums will always give the correct result.
And because it is commutative, the order we perform that final aggregation does not matter.
Not exactly 100% though In practice, floating-point addition is not commutative, as explored in this Thinking Machines article about non-determinism in LLMs, but that’s a can of worms for another day.
So yes, moving your code to the GPU can change the results of your reductions! Welcome to this beautiful mess.
Summing vectors on the GPU
In practice, we want to sum batches of vectors independently, say a batch of 65536 vectors, each of length 2048. The result will be 65536 independent sums. This should be a beefy enough workload to saturate the GPU's resources and keep us warm for a bit.
There are many ways to organize this work, but we’ll keep it simple by creating as many thread blocks as vectors we need to reduce. This way, each thread block is responsible for one vector, and will write a single number as a result.
The grid, blocks and threads in CUDA lore When you launch a CUDA kernel, you tell it your problem size so the GPU can allocate compute and memory accordingly. This is called a launch grid, which is composed of many thread blocks, which are composed of many threads. A thread actually runs your kernel.
There are no limits to how many blocks grids have, but hardware imposes a limit on how many threads each block can have: 1024.
The most naive approach: atomicAdd
Technically, the easiest way to do this is have each thread read a value from global memory and add it to the output with an atomic write. But that is a terrible option! The GPU will serialize all writes to the same value, so we might as well be using CPUs and locks.
We need a more parallel-friendly approach.
Hierarchical reduction
The plan is to do log(N) iterations where each thread does one addition. At the end, the first thread contains the sum of the entire N values. Beautiful, no? We only need N/2 threads.

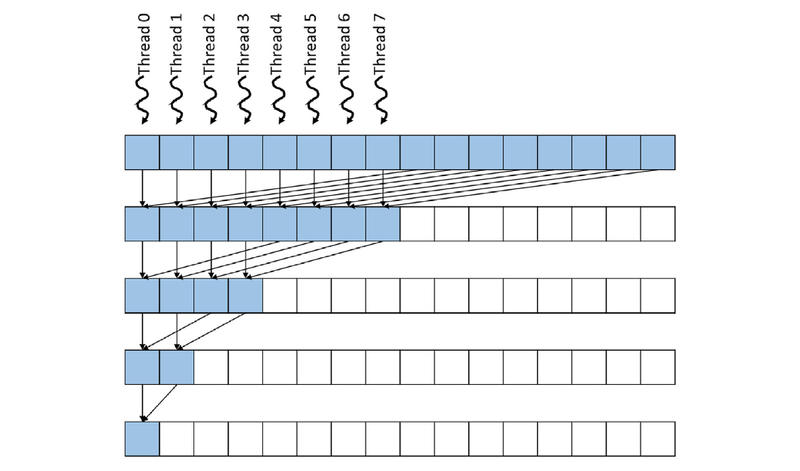
You'll notice in this picture, though, that after the first step, when each of the 8 threads contains a partial sum, thread 0 needs to add itself to the value at thread 4.
How can a thread get the value from another thread? Turns out, thread blocks have access to a shared pool of memory that only threads within that block can read and write to. It is known as shared memory or L1 cache, and it’s entirely programmer-managed! It is also ten times lower latency than going to global memory.

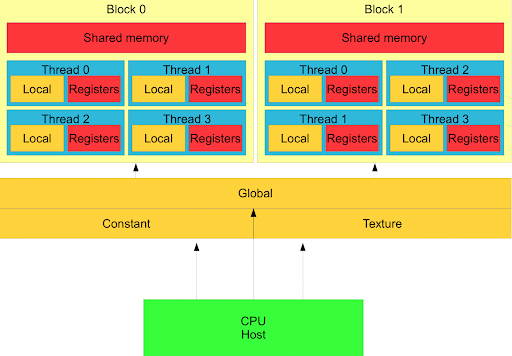
This memory hierarchy is a powerful tool—memory closer to the computing core is orders of magnitude faster and smaller than the next one further away. With careful planning, we can both perform fancy coordination while avoiding contention and unnecessary roundtrips.
So our plan is:
Choose the number of threads per block, for example,
blockThreads = 512.Accumulate chunks of
blockThreadsvalues from global memory into shared memoryPerform reduction hierarchically in fast shared memory
Write sum back to global memory
Let's give it a go!
const int blockThreads = 512;
__global__ void sum_kernel(float* out, float* input, size_t vector_len) {
// we need to declare shared memory explicitly,
// as it's programmer-managed
__shared__ float shmem[blockThreads];
size_t vector_idx = blockIdx.x; // which vector are we summing?
size_t tid = threadIdx.x; // which thread in the block are we?
// offset to find the vector we need to work on
size_t vector_start = vector_idx * vector_len;
shmem[tid] = 0.0;
__syncthreads();
// reduce with a grid stride loop to handle reduce_size > blockThreads
for (size_t idx = tid; idx < vector_len; idx += blockThreads) {
shmem[tid] += input[vector_start + idx];
__syncthreads();
}
// reduce in log N steps, accumulating onto shared memory
for (int stride = blockDim.x / 2; stride >= 1; stride /= 2) {
if (tid < stride) { shmem[tid] += shmem[tid + stride]; }
__syncthreads();
}
// the first thread in each block writes the final sum
if (tid == 0) {
out[vector_idx] = shmem[0];
}
} Benchmark Time FLOPs/s
--------------------------------------------------
SumFp32/65536/2048 0.454 ms 295.582 GFLOPs/sNot too bad. But to progress from here, it’s time to let you in on a little secret.
The Hidden Code
There is a hidden code CUDA programmers live by, a set of commandments. They encode arcane knowledge about living in harmony with the physical hardware that actually runs the code, instead of blindly trusting the leaky abstraction that is the CUDA programming model.
Those who ignore the commandments are doomed to Slow Limbo, where kernels take forever to run while GPU compute sits idle.
Those who follow them, some claim, will see their FLOPs/second go up.
#1: You Shall Coalesce Memory Accesses
This is one of the most important principles.
The CUDA code we write runs on compute cores in an SM (Streaming Multiprocessor), physically far from global memory (VRAM).
When a thread reads or writes memory, the SM groups those operations to better utilize the memory bus. It can only do this if they are coalesced.
Coalesced Reads & Writes Memory accesses are coalesced only if threads access contiguous memory addresses.
If thread 0 accesses memory position 16, thread 1 accesses position 17, and thread 2 accesses position 18, it is a coalesced access and can be done in a single trip to memory.
If you look at our kernel, we respect this principle in the first reduction stage:
for (size_t idx = tid; idx < vector_len; idx += blockThreads) {
shmem[tid] += input[vector_start + idx];
__syncthreads();
}Thread 0 (
tid == 0) adds offsets 0 and blockThreads in a vector.Thread 1 (
tid == 1) adds offset 1 and offset blockThreads + 1 in a vector.Etc. This causes one coalesced read per loop iteration.
In the log(blockThreads) hierarchical reduction:
for (int stride = blockDim.x / 2; stride >= 1; stride /= 2) {
if (tid < stride) { shmem[tid] += shmem[tid + stride]; }
__syncthreads();
}Even though at each loop iteration we halve the number of working threads by 2, accesses to and from shared memory remain coalesced.
So we are doing okay on this front. What else can we learn from the hidden code?
#2: Not All Memory is Created Equal
SMs physically have an L1 and L2 cache inside (the smaller number means it is closer to the compute). We are using shared memory heavily, with typical latencies around 30-40 cycles, 10x faster than global memory. So far so good.
But there is an even faster memory we almost never think of as such: registers!
Each thread has a very small number of allocated registers that are fast; their latency is 1 cycle. That is 30x-40x faster than accessing shared memory.
As the proverb goes:
Don’t go back and forth to global memory if you can do it in shared memory, and
Don’t go back and forth to shared memory if you can do it in registers.
In particular, the first strided accumulation we could do from global memory to registers entirely! Then, do a single write to shared memory:
// first accumulation in registers
float thread_sum = 0.0;
for (size_t idx = tid; idx < vector_len; idx += blockThreads) {
thread_sum += input[vector_start + idx];
}
shmem[tid] = thread_sum; // single write to shared memory
__syncthreads();Benchmark Time FLOPs/s
--------------------------------------------------
SumFp32/65536/2048 0.415 ms 323.534 GFLOPs/sA 10% speedup! The elders are onto something.
But surely we can do more. There is a technique called warp reduction that we might be able to use. What is a warp, you say? Ah, I forgot to tell you:
#3. Threads Aren’t Real
Well, they sort of are, but it makes no sense to think of them as truly independent. An SM, like any computing device, has a scheduler. When you launch a grid, you assign a backlog of thread blocks to work on, and the SM decides what to launch when—and since it is quite smart, it likes having a large backlog of things it can multitask on.
But the SM scheduler cannot schedule work onto individual threads. Instead, it schedules work onto warps: groups of 32 threads, in a SIMT fashion (single instruction, multiple threads). All threads in a warp execute in lockstep, and there is no way to avoid that.
In fact, if you add a conditional like if (tid == 0), you’ll still take up an entire warp to run, but only the first thread will do anything. The other 31 threads will stall and wait. If there was an else branch, the scheduler now has to issue 2 instructions in sequence: one for the first thread, and one for the other threads in the warp.
Warp reductions
So what are warp reductions? They are a technique that benefits from special coordination operations that threads in a warp can do, in a single cycle, without locks, shared memory, or anything else. For example, we can do a hierarchical reduction entirely in a warp!
for (int offset = 16; offset > 0; offset >>= 1) {
val += __shfl_down_sync(0xffffffff, val, offset);
}__shfl_down_sync takes what is in the thread offset to the right of us and puts it into our val register. We can use that to reduce 32 values onto 1, and each of the log(32) steps takes 1 cycle to move things around. Awesome!
Putting it all together
Let’s implement our fancy new warp reduction in our kernel. To do that, we’ll cut the shared memory reduction short until we have a warpful of values (32 values). Then, we’ll reduce those with a fast warp reduction.
__global__ void sum_kernel(float* out, float* input, size_t vector_len) {
// we need to declare shared memory explicitly,
// as it's programmer-managed
__shared__ float shmem[blockThreads];
size_t vector_idx = blockIdx.x; // which vector are we summing?
size_t tid = threadIdx.x; // which thread in the block are we?
// offset to find the vector we need to work on
size_t vector_start = vector_idx * vector_len;
// first accumulation in registers
float thread_sum = 0.0;
// reduce with a grid stride loop to handle reduce_size > blockThreads
for (size_t idx = tid; idx < vector_len; idx += blockThreads) {
thread_sum += input[vector_start + idx];
}
shmem[tid] = thread_sum; // single writes to shared memory
__syncthreads();
// reduce in log N steps, accumulating onto shared memory
// stop when we have 32 values
for (int stride = blockDim.x / 2; stride > 32; stride /= 2) {
if (tid < stride) { shmem[tid] += shmem[tid + stride]; }
__syncthreads();
}
// warp shuffle for the final warp-level reduction
if (tid < 32) {
float val = shmem[tid]; // load from shared memory
for (int offset = 16; offset >= 1; offset /= 2) {
// accumulate "down"
val += __shfl_down_sync(0xffffffff, val, offset);
}
if (tid == 0) {
out[vector_idx] = val;
}
}
}Benchmark Time FLOPs/s
--------------------------------------------------
SumFp32/65536/2048 0.414 ms 323.872 GFLOPs/sWhat? 1 microsecond faster. After all, didn’t we save 5 calls to __syncthreads (the final iterations, 32 down to 1)? I’m going to complain at the CUDA Elders Council.
I'm back. They told me to re-read the third commandment and atone for being such a silly goose.
Since threads aren’t real, __syncthreads is actually a barrier different warps arrive at, not threads. The final iterations we saved happened within a warp anyway! So putting such a barrier when only one warp is active is a no-op.
Time and again, truly thinking about the hardware from first principles helps anticipate which optimizations are likely to have an effect.
The commandments are useful guides, but grounding them in empirical data from actual hardware is always mandatory.
How to add two vectors, fast
I’ve been building a Llama 3.2 inference engine aptly named forward (purely as an excuse to stop procrastinating and learn modern C++ and CUDA), from scratch. Were I reasonable, I would not have decided to build a tensor library first, then a neural network library on top of it, and finally the Llama 3.2 architecture as the cherry on top. But here we are. The first milestone was getting Llama to generate tokens correctly on the CPU first, with every activation of every layer matching the Huggingface Transformers inference output. Milestone achieved! The next milestone, which I’m currently starting, is getting it to run as fast as I can on my NVIDIA GPU, an RTX 5090. The very first kernel I wrote is a timeless classic: adding two vectors element by element. Walk with me. Wait, why are you running away. Adding two vectors on the CPU Let’s start with a baseline to convince ourselves whether using a GPU is worth it in the first place. We want to add fairly large vectors, at least 134M elements each. This reflects the kinds of vector additions we will be doing during real-world Llama inference. Plus, each element will be a bfloat16 number, which for this article is just like a floating point number taking up 2 bytes of memory (16 bits). On the CPU, that means creating a blank output vector of 134 million elements, iterating over the input vectors to add their elements, and write the result to the output vector. (I’ve removed extraneous details like templating and broadcasting for legibility, but you can check the actual CPU implementation in the repo if you’d like your eyes to bleed.) Let's benchmark it. We will measure everything with a single throughput metric: FLOPs/s (floating point operations per second). Each addition is a floating point operation, so we will perform 134M of those and see how fast it is. It took 135 milliseconds to do all the additions, yielding just under 1 GigaFLOP per second of throughput. 1 GigaFLOP is 10^9 FLOPs (1 billion, in U.S. parlance). Not bad, right? Actually pretty bad. We are using a single CPU thread to do all the additions sequentially, but the additions are independent of each other. Can we parallelize without breaking our brain too much? Let’s try using OpenMP, which only takes adding a line before our for loop. It will magically spawn a bunch of threads and split the work between them: A 2.4x throughput increase with one line of code? Sign me up. But surely we can do better using these expensive NVIDIA heating devices. Let’s dust off the CUDA books and make our GPU go brrr. A simple CUDA kernel This looks pretty similar to our CPU version, but without the for loop. This function will run in a separate CUDA thread for each of the 134M elements—so all it needs to do is figure out which element idx it is responsible for, read one element from vector_a and one from vector_b, add them up, and store them in out. CUDA lets us decide how to split the work, how many threads we need, etc. We need one thread per output element. Threads are organized in thread "blocks," which are laid out in a "grid"—don't worry about this, it's arbitrary, but we need to tell CUDA how big our thread blocks are and how many of them we need. We can launch our kernel by converting from our bfloat16 type to CUDA’s equivalent __nv_bfloat16 and telling CUDA what launch grid configuration we want: Let us benchmark against the baseline: Just over 1 millisecond! Our naive CUDA kernel is around 49x faster than the parallelized CPU version. But how good is that? How can we know whether our expensive heater is being utilized to its full potential? Benchmarking against our potential To answer that question, we have Nsight Compute, or its CLI version called ncu, which comes with the CUDA Toolkit. Let’s profile our kernel with it, and look at the first section, called GPU Speed Of Light Throughput: SM stands for Streaming Multiprocessor, a collection of CUDA cores, a scheduler, and other details we do not care about right now. My GPU has 170 SMs, with 128 CUDA cores each. Let's first focus on Memory Throughput and Compute (SM) Throughput. These percentages show how well our kernel utilizes available memory bandwidth and compute, respectively. From the theoretical peak compute throughput, we are getting only 19.20%. That means, 80.80% of the time, our CUDA cores are sitting idle, waiting, not computing anything. Before we call NVIDIA and ask for an 80% refund, let’s ask ourselves. What are these precious CUDA cores waiting on? Looking at the kernel again, we can focus on what it is actually doing: Each thread: Loads one element from vector_a from global memory (commonly known as GPU VRAM) into a register. Loads 1 element from vector_b from global memory into a register. Adds them up and stores the result in a register. Stores the result from a register into out , which is also global memory. The CUDA cores only compute in step 3. Before that, it must wait for steps 1 and 2, and afterward, it must wait on step 4. Adding two numbers takes 4–6 cycles, whereas memory operations to and from global memory (VRAM) take 200–400 cycles, orders of magnitude slower than the addition itself! Fortunately, GPUs are excellent at hiding latency by running more threads while others wait on memory, but still. There must be something more we can achieve with our fancy CUDA programming skills. A fancy kernel Let’s start with data movement. Each thread is currently loading a single bfloat16 value from each vector, but since we are making the trip to global memory anyway, why can’t we carry more stuff back? Like getting eight bfloat16 values at a time? Loading 8 bfloat16 values in one go The way we can do that is by pretending we want to load a 128-bit value, and then slicing it into our 8 bfloat16s. Memory is laid out linearly, so we can get away with that! We tell CUDA, “I want to read a pack of four 32-bit integers from global memory.” We then reinterpret this as a pointer to an array of bfloat16 values: Now we can perform eight additions. Or can we get away with fewer instructions? Doing two additions for the price of one Turns out there is a packed bfloat16 type called __nv_bfloat162 (notice the 2 at the end, which means it contains two bfloat16s). We can add two __nv_bfloat162 values to do two additions in parallel with a single instruction this way. All we need is to change how we interpret the original uint4 packed value: Then, when adding __nv_bfloat162 values, we add two __nv_bfloat16s in parallel with a single instruction. Nice! Our kernel now looks like this: Let’s benchmark and get ready to get paid the big bucks. What? Only 10 microseconds faster after doing a PhD on the CUDA math API docs? Compute-bound vs memory-bound kernels How can we make sense of this? A useful concept captures the kind of kernel we are writing: How much compute do we do for each byte we read or write? In our case, it is one add instruction versus two 16-byte reads and one 16-byte write: 0.021 FLOPs/byte. We are basically just moving memory around the whole time, occasionally performing a tiny amount of compute. It might seem wasteful, but there is little we can do about it—it is exactly what our kernel needs to do. Our kernel is memory-bound, meaning it is limited only by memory bandwidth (1.7 TB/s in my GPU), not compute. Why isn’t the fancy kernel faster than the simple one? Recall the GPU Speed of Light Throughput table? We are utilizing the memory bandwidth close to optimally already, which is why loading more bytes at once makes little difference. As per the additions with the __nv_bfloat162 packed type, we perform two additions with a single instruction, which bumps our Arithmetic Intensity to… 0.042 FLOPs/byte. Compute is such a tiny part of our kernel that it does not matter if we do it twice as fast. We are still memory bound. Additionally, our more complex kernel uses more registers—a limited resource that, if abused, limits how many concurrent threads can run on an SM, so occupancy decreases. There is no free lunch. Conclusion GPU optimization is both an art and a science, but it pays off to learn the specific hardware you are targeting, formulate and test hypotheses, and always measure everything. Another win for the most widely applicable meme of all time, I guess.
You are not the code
It was 2016. I was listening to Justin Bieber's Sorry (and probably so were you, don't judge), coding away at my keyboard in an office building in Canary Wharf, London. We were a small team working on a complex internal tool for power users. Our tools were Clojure and ClojureScript, which we wielded with mastery and pride. The great thing about building for advanced users is that they are as obsessive as you are about their own domain and will seize the edge wherever they can find it. So you build, they adopt early, you get feedback, and the cycle continues. It is a powerful feeling. The platform we were building was meant to visualize and sift through tons of data, slicing and dicing it to make informed decisions quickly. We provided a few common views and predefined filters, designed by our invaluable Product Owner who used to do our users' job—he understood deeply what they needed. One day, I got an idea. (The smartest and poorest decisions of my life both begin alike, as it turns out.) I wanted to craft a sharp knife and entrust the users with it. I was going to design a simple query language based on boolean algebra. A week went by. Then another. Bieber on repeat, living in a continuous state of flow, my regular life put on hold. All I could think of was this language, and how powerful our most advanced users would feel using it. After a couple of weeks, I was ready to demo the feature branch to Manish, my manager. At that point, he knew me well enough to know I hadn’t been doing what I was supposed to be doing, and that it was wiser to ask instead. “What are you up to these days?” Filled with pride, I told him I wanted to show him something cool. He smiled and grabbed a seat next to my desk. "Go on," he said. He immediately noticed the new text field above the data display. I typed a complex boolean query, and voilà! The data I wanted was there, almost instantly. Without stopping, I continued explaining all you could do with this powerful language. Users could save their own queries to use later. The interface was fairly self-discoverable, with syntax highlighting and readable errors explaining how the queries were meant to be written. “This is very cool,” Manish said with a smile. Pride swelled in my chest. “However… we are not going to ship it.” His demeanor turned more serious, with a hint of kindness. I frowned and said incredulously, "What? Our users are power users. They deserve at least to try this! If they do not like it, we can roll it back." “I get it. But this is not the direction we will take right now.” There was no malice in his voice, just kindness and empathy for how important this was to me. He did not put a hand on my shoulder, but I almost felt it. In that moment, a rush of feelings overcame me. I sensed a fire starting to roar in my belly, one that could easily burn down the entire building. But then, a sudden calm set in. I went to the terminal and slowly typed the command to delete my entire feature branch: Then I hit enter and braced for grief. But it never came. Instead, relief took its place. The code was gone, but I was still there. And with me were those two weeks of pure joy, focus, flow, learning, and growth. And new knowledge about building languages, too. For the first time in my career, I understood all at once: I am not the code. The code is an artifact, a byproduct of an ongoing process. That ongoing process is my growth as a programmer, as an eternal student of everything, as a person. I also understood that I had been carrying all the code I had ever written, petrified into my identity. If you questioned my code, you questioned me. If my code was broken, a part of me was broken too. Just a few years earlier, that whole situation would have unfolded differently. But instead, a moment of lucidity and a simple terminal command taught me one of the most valuable lessons in my career.